Track your group’s investment performance across multiple time periods using the Multi Period Returns – Detailed Report in MProfit. This report gives you a comprehensive view—showing valuations, inflows, outflows, gains, and benchmark comparisons—to help you analyze your investments with precision.
Navigating to the Multi Period Returns Report
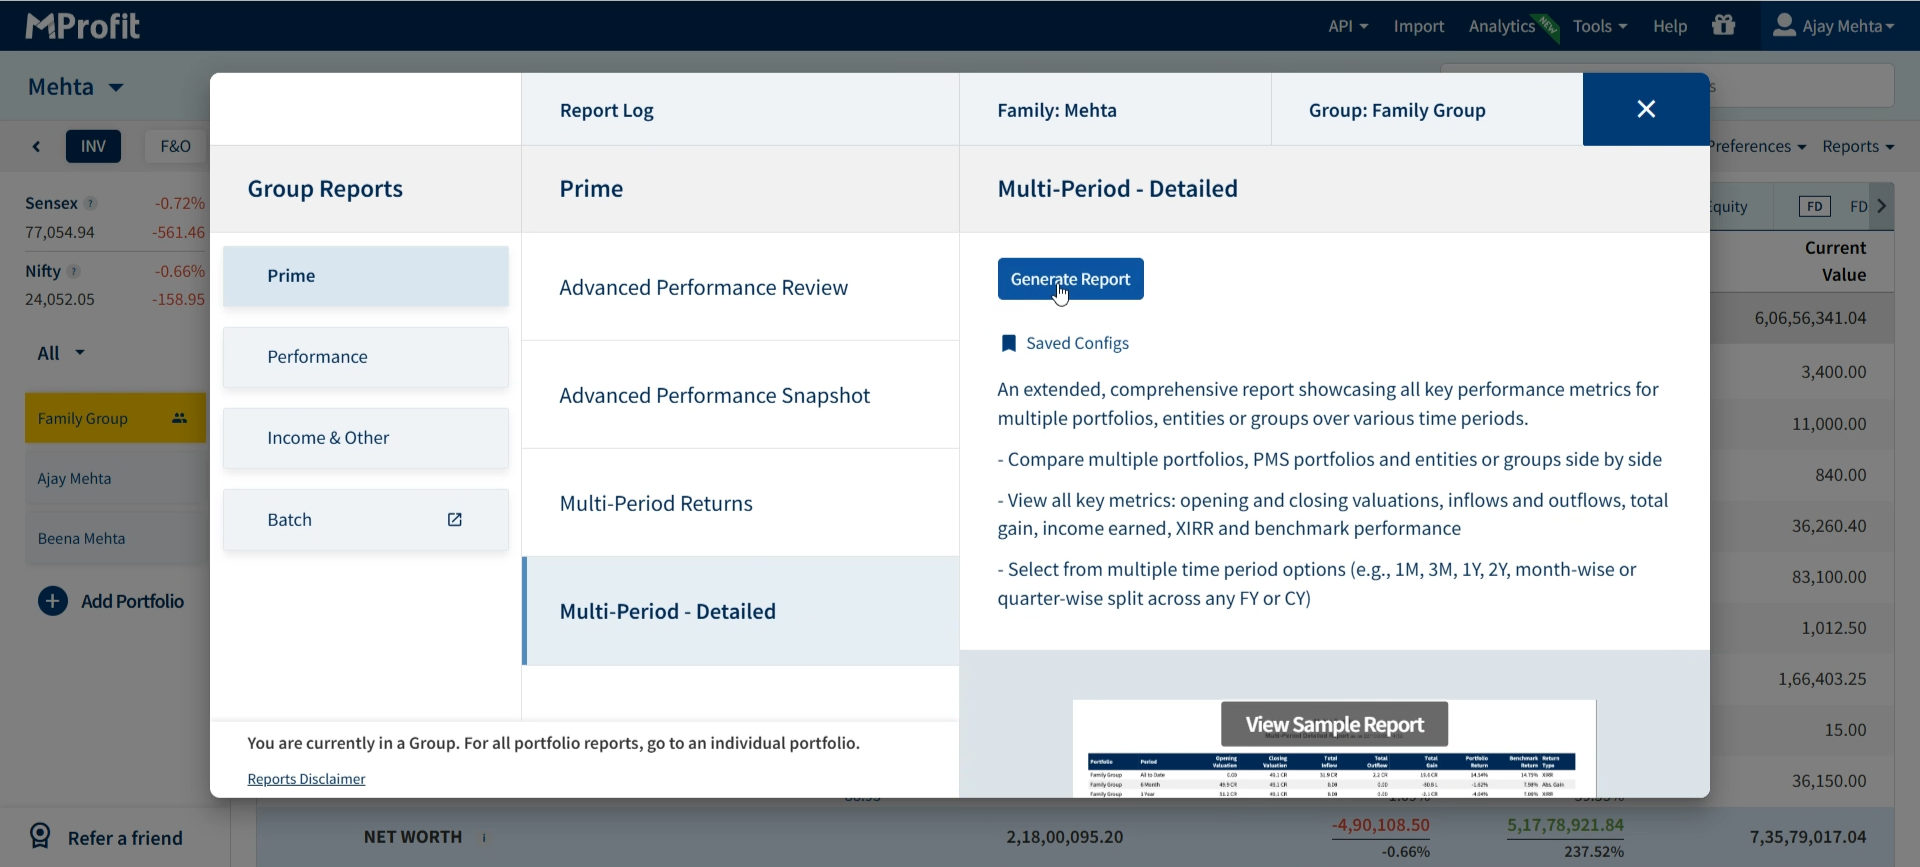
Step 1: Select the group you want to analyze.
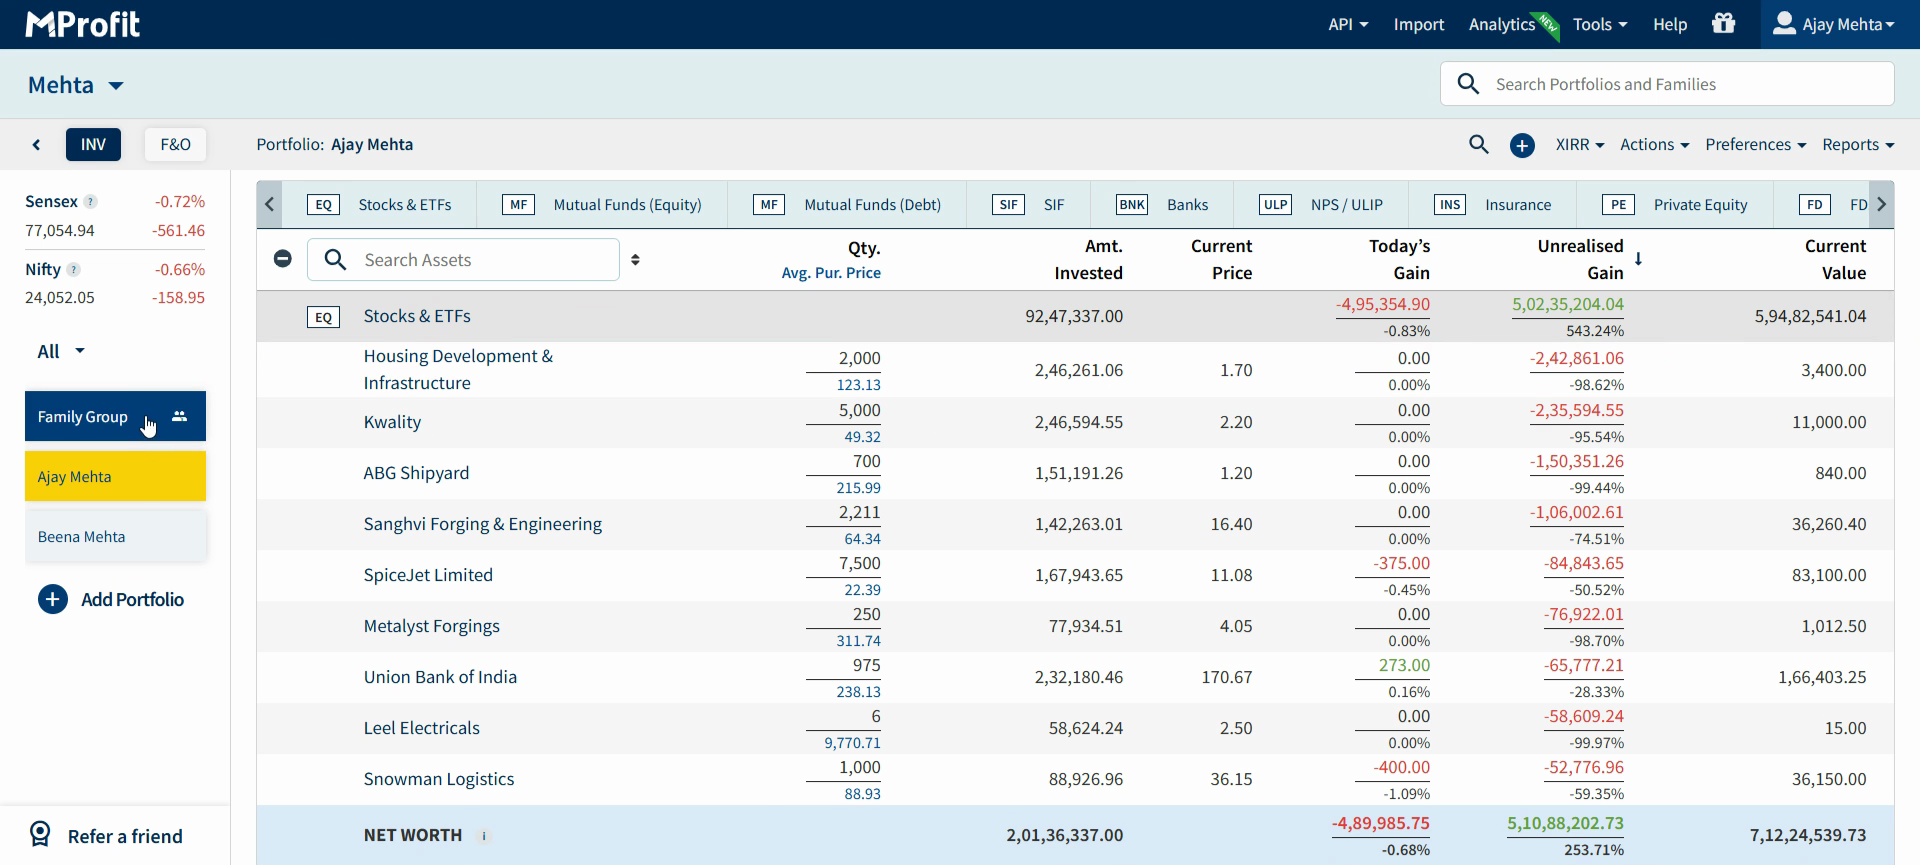
Step 2: Go to the Reports section.
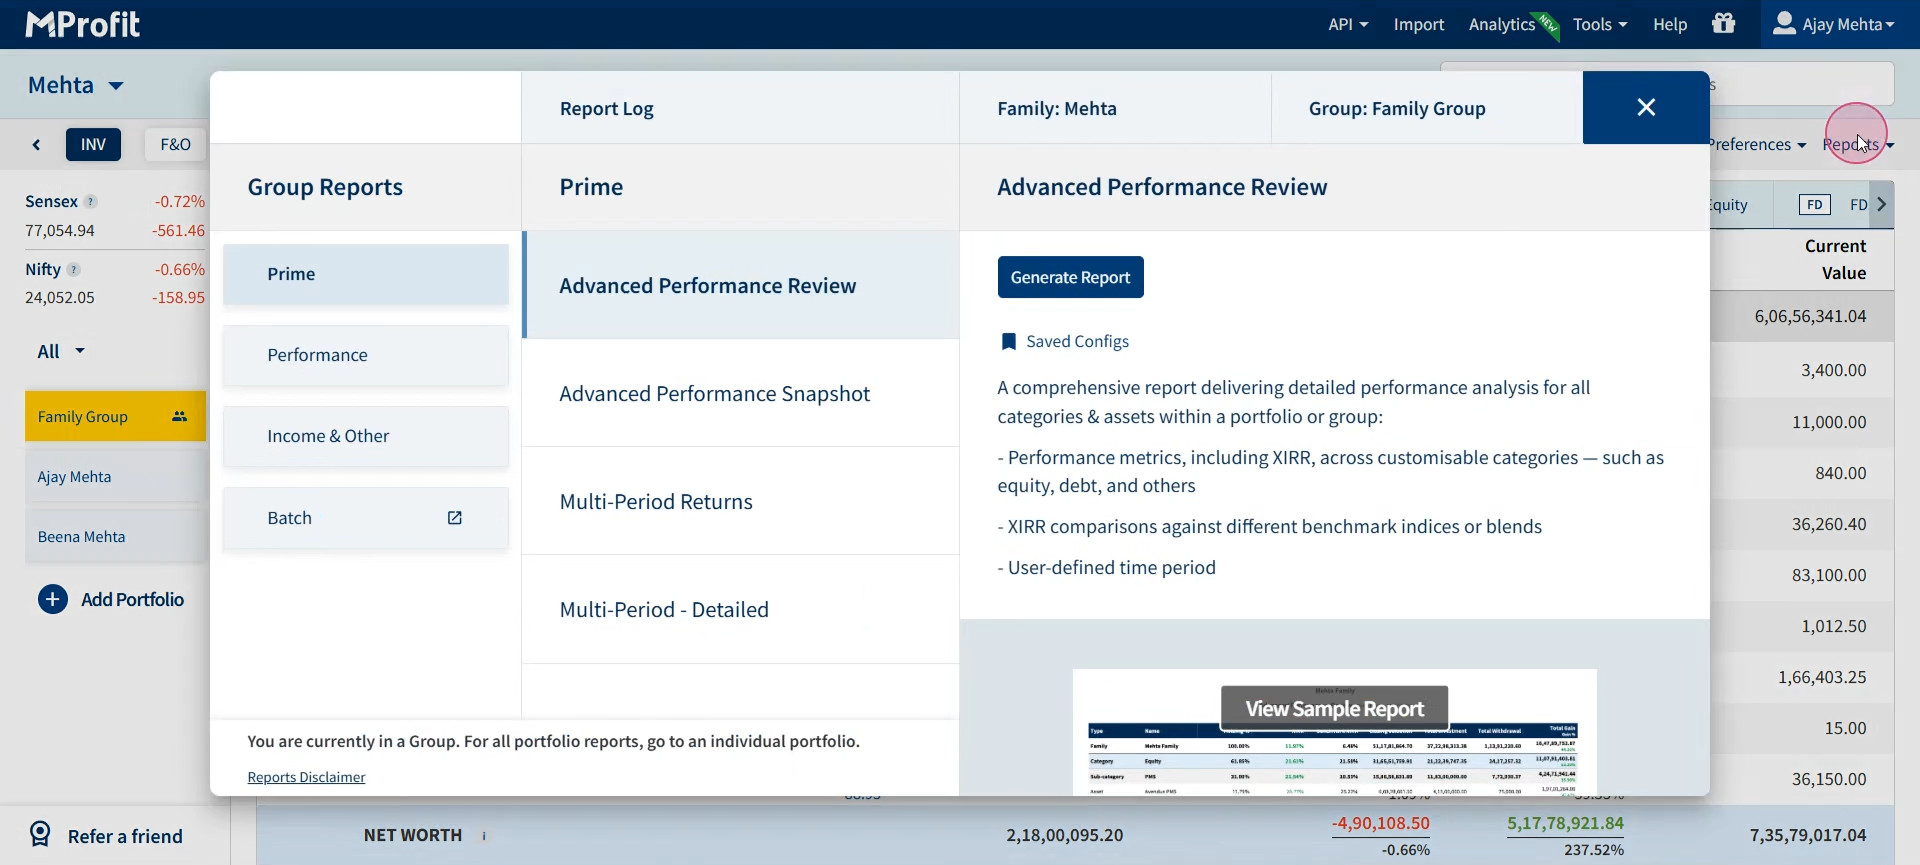
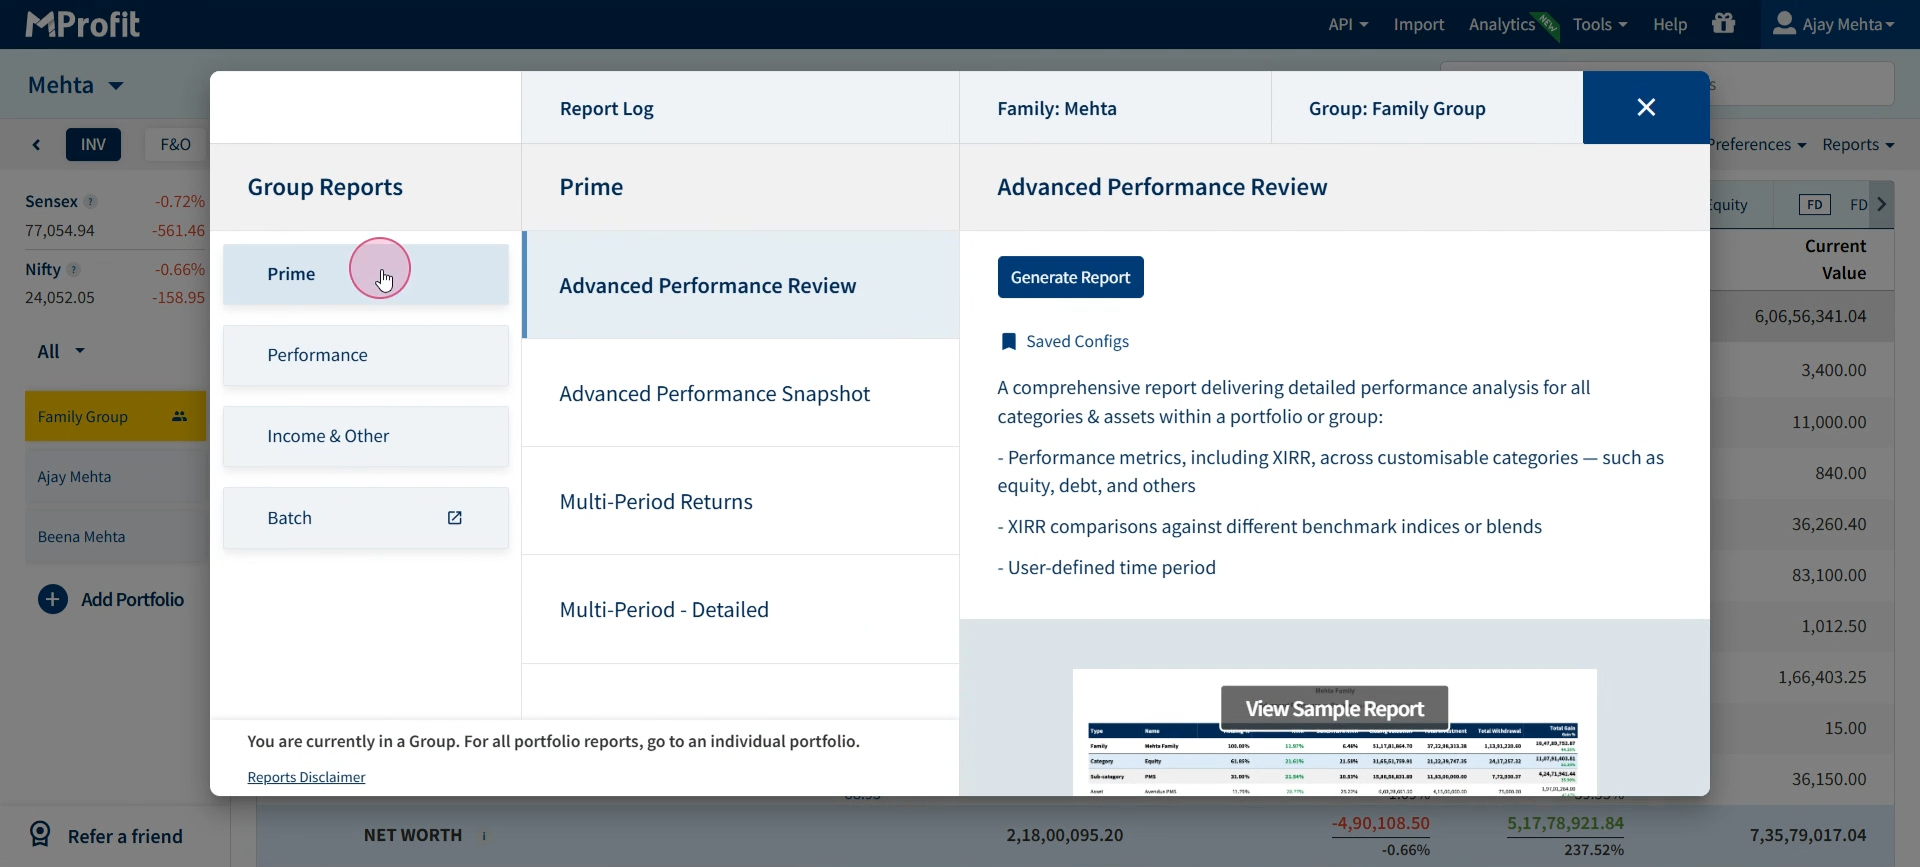
Step 3: Open the Prime category.
Step 4: Click on Multi Period Returns – Detailed Report.
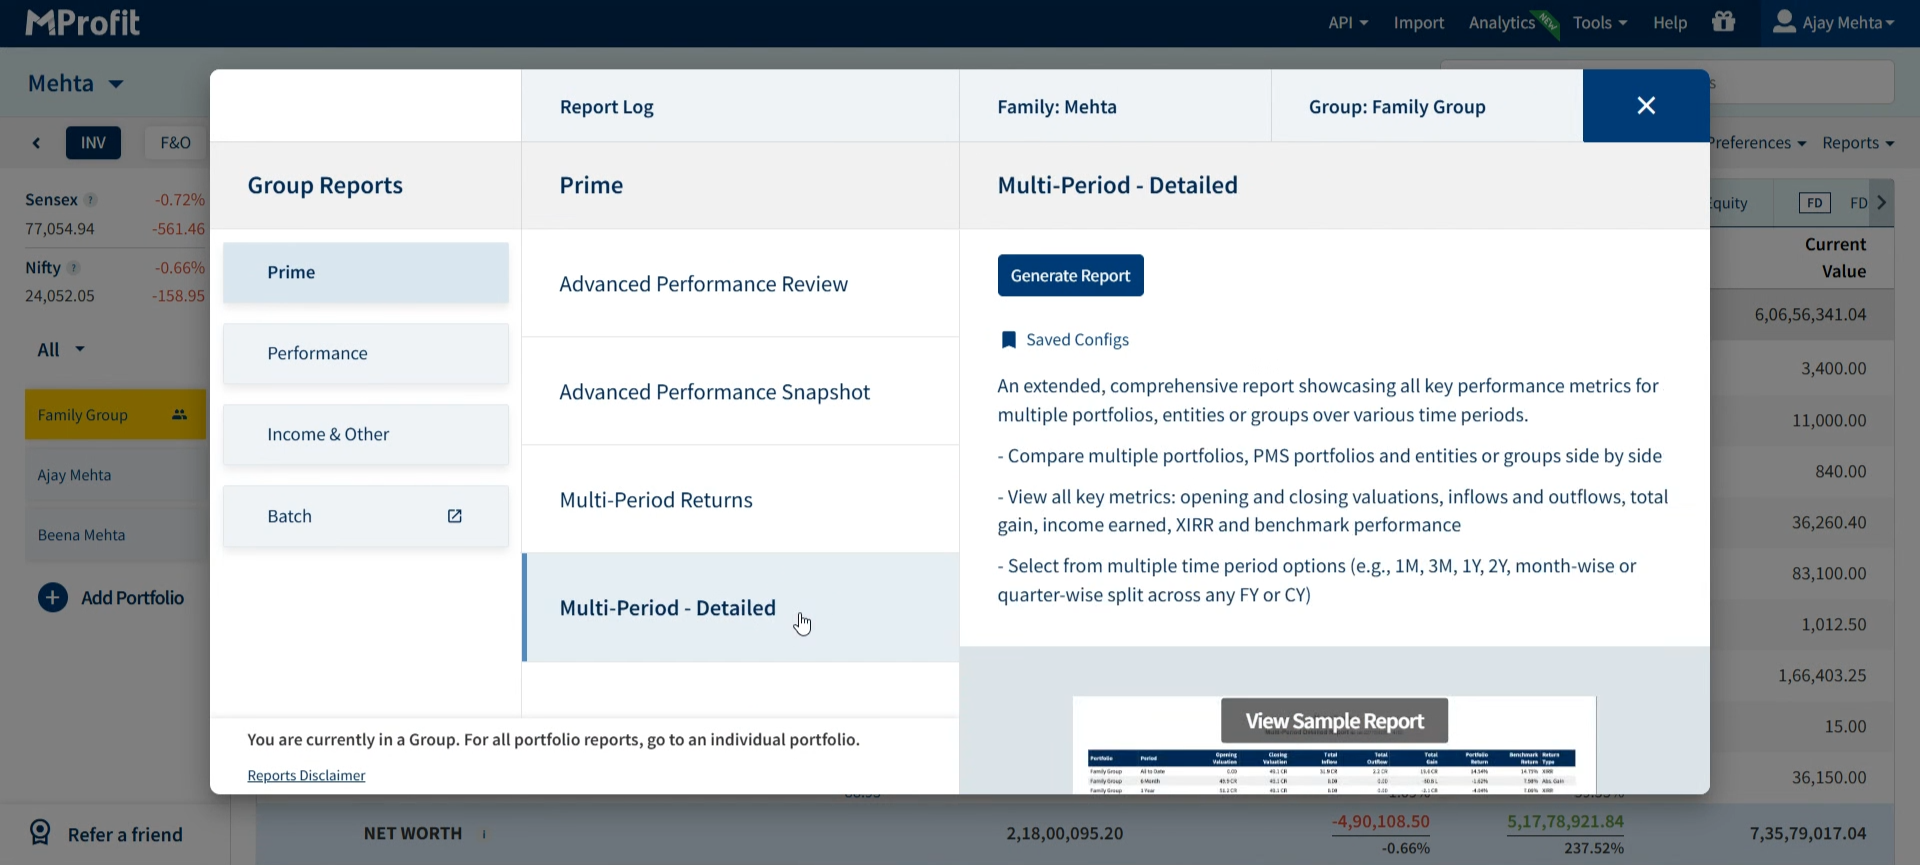
Step 5: Click Generate Report.
Customizing the Report
A customization window appears, letting you tailor the report to your needs.
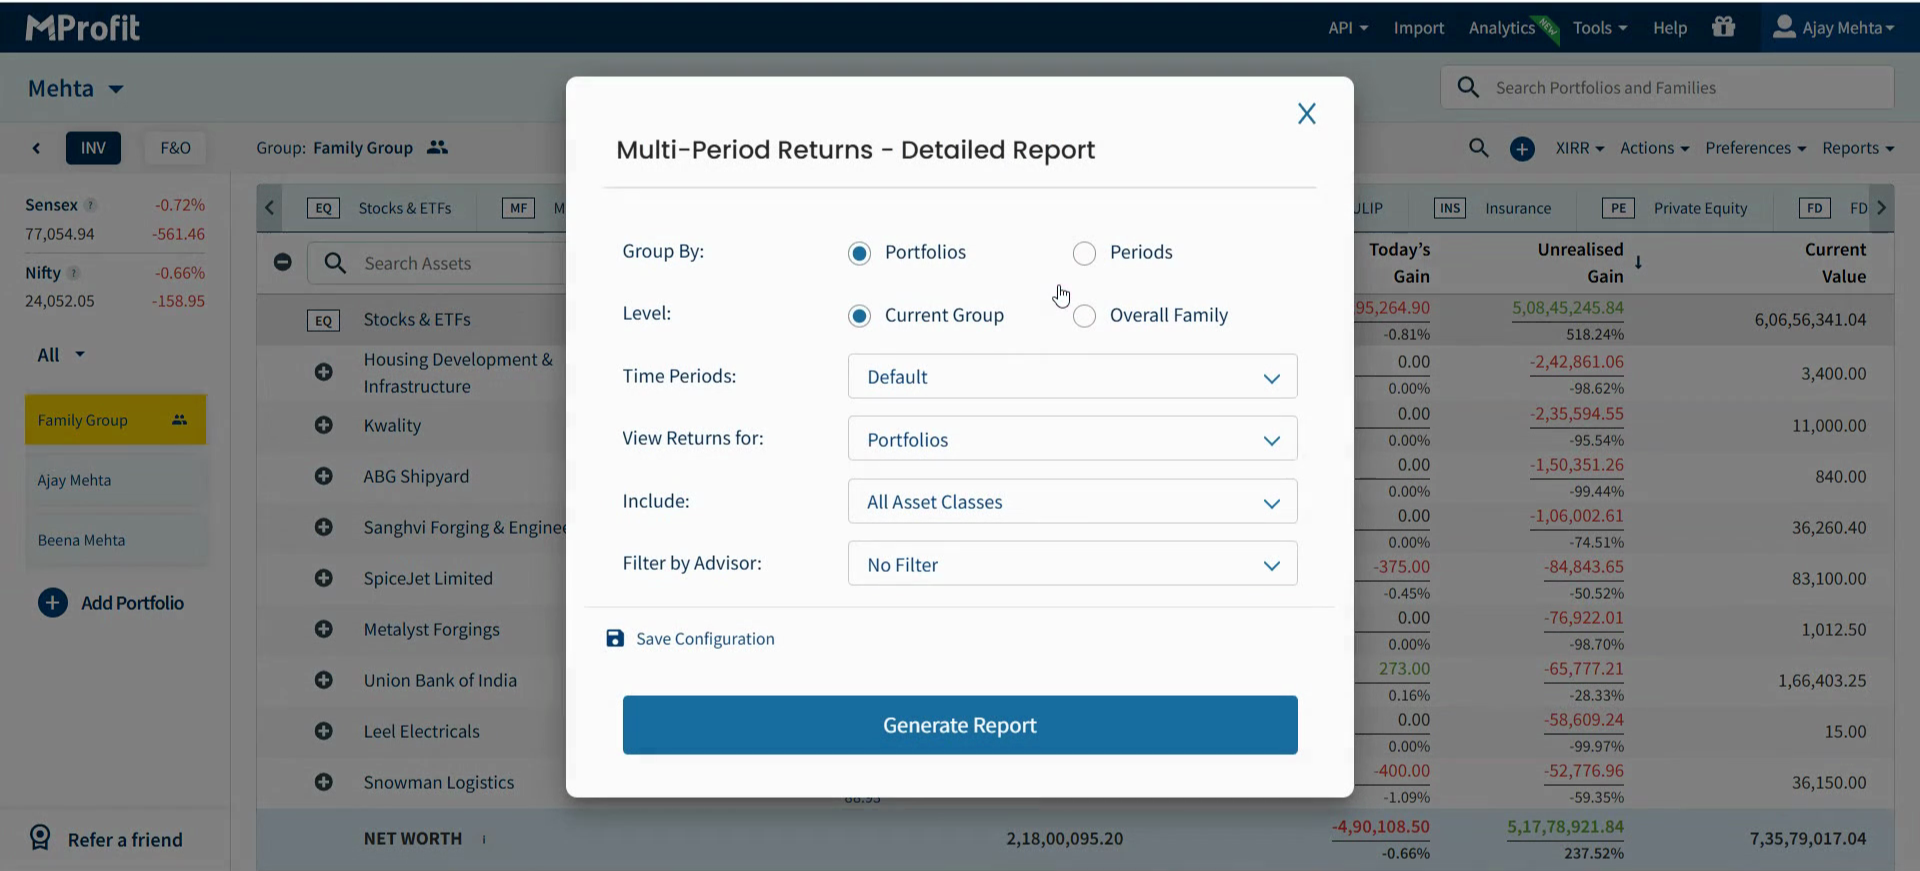
Step 1: Choose how to group your data using the Group By dropdown. For example, select Portfolio to view results by portfolio inside the group, or Periods for a period-wise comparison.
Step 2: Set the Level to include only the current group or the whole family. Choose Current Group for just the selected group, or Overall Family for all related groups and portfolios. For this example, select Overall Family.
Downloading and Reviewing the Report
Once generated, your report is ready for download.
Step 1: Click to download in Excel or PDF format.
Step 2: For this demo, download the Excel version and open it.
Step 3: Review the detailed information in the report:
First column: Group or portfolio name
Period column: Time interval
Opening valuation: Value at the beginning
Closing valuation: Value at period close
Total inflow: Amount invested during the period
Total outflow: Amount withdrawn
Net inflow: Inflow minus outflow
Total income: Income earned
Total gain: Overall gains for the period
Portfolio return: Return percentage for each entry
Benchmark return: Compare your returns with assigned benchmarks
Return type: Whether gain is absolute or XIRR, based on holding period
Benchmark: Assigned benchmark for that group or portfolio
The Multi Period Returns – Detailed Report in MProfit helps you track and analyze investment performance across multiple periods, providing clear insight for better financial planning. Use these steps to generate, customize, and review your reports, making it easier to measure growth and compare returns over time.
Was this article helpful?
That’s Great!
Thank you for your feedback
Sorry! We couldn't be helpful
Thank you for your feedback
Feedback sent
We appreciate your effort and will try to fix the article