In this tutorial, we will explain how to view your PMS performance snapshot in MProfit.
This tutorial focuses on how to track key performance metrics for the PMS, including XIRR, Profit and Loss, Income Earned, and Fees Charged.
Step 1: Login to your MProfit account and select the PMS portfolio.

Step 2: Now, navigate to Analytics.

Step 3: Here you can see the Today, Holdings and Performance.

Step 4: Now, click the Performance tab.

Step 5: The PMS Portfolio XIRR is calculated considering the Cash In, Cash Out, Current Investment Value, and Cash on Hand.

Step 6: You can also track the Cashflow Summary.

Step 7: The Total Fees Distribution also can be tracked seamlessly.

Step 8: Here, you can view the Cashflow Snapshot, which shows the Cash In, Closing Cash, and Closing Investment Value.

Step 9: You can also compare your Portfolio XIRR vs. Index CAGR.
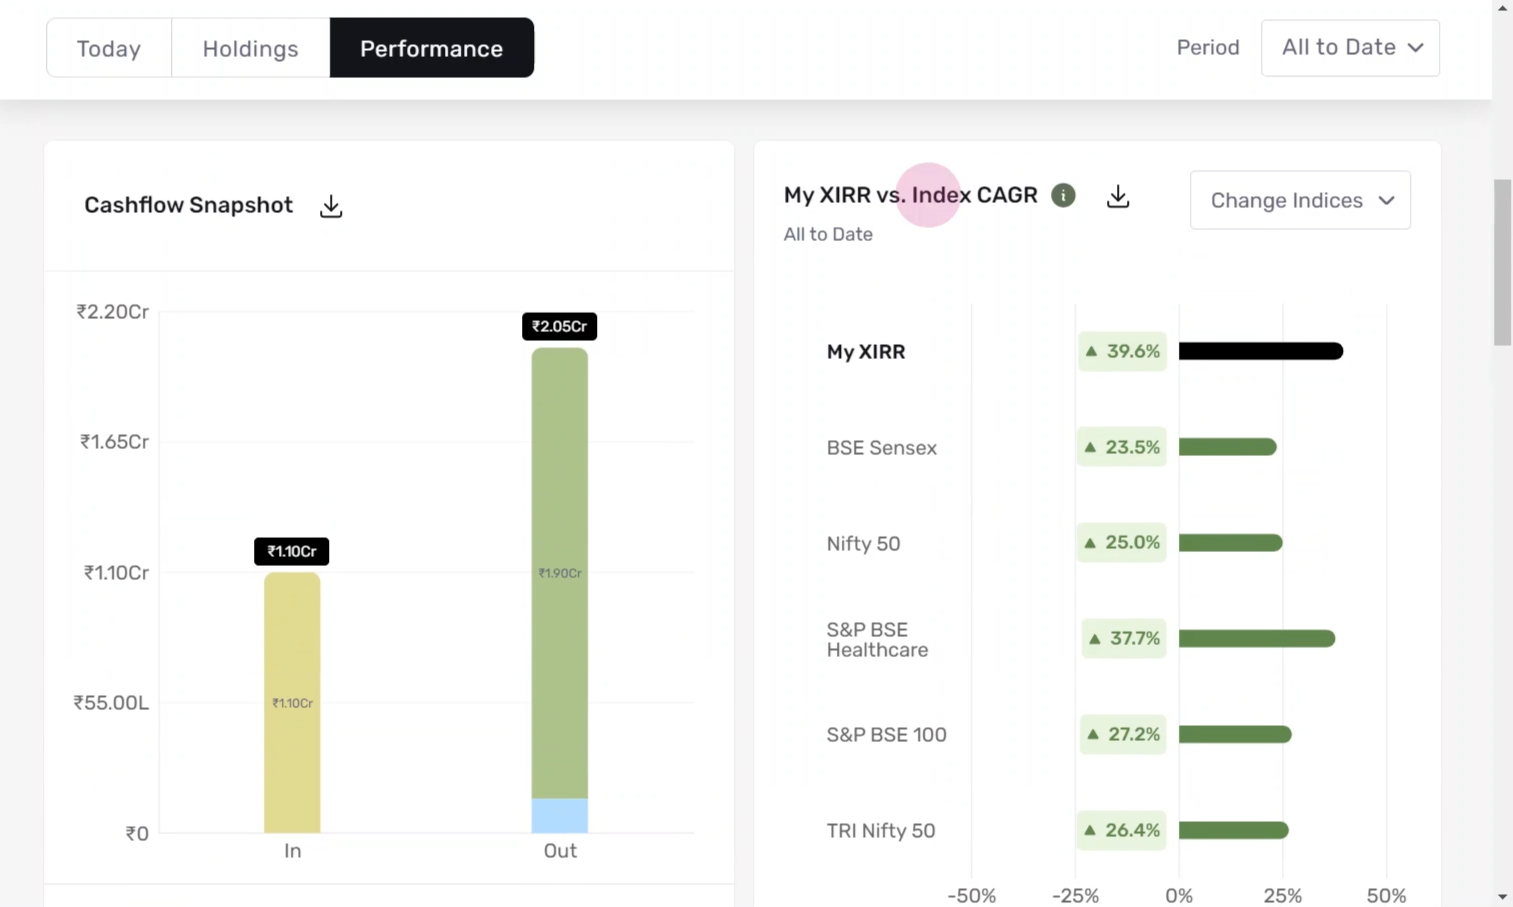
Step 10: You can select up to 5 indices at a time.

Step 11: You can also perform XIRR Comparison to compare portfolio XIRR with equivalent cash flows in the index.

Step 12: You can also view the Performance by Asset Class Table.

Step 13: The Advanced Performance Insights Chart can also be viewed, which is like any regular non-PMS portfolio.
Also, you can click the download sign to download all the reports in PDF.

This is how you can view your PMS performance snapshot in MProfit!
Was this article helpful?
That’s Great!
Thank you for your feedback
Sorry! We couldn't be helpful
Thank you for your feedback
Feedback sent
We appreciate your effort and will try to fix the article